# Manage Connectors
Manage connectors in a database application to ensure smooth data flow, security, and stable performance. Monitor and maintain connectors to prevent data bottlenecks, reduce delays, and keep the system efficient under varying loads.
## Post-Setup Display and Actions
The Connectors page contains all the configured connectors, including connected and saved ones. The grid view in the Connectors page improves the search experience with filter, sort, and search options based on connector attribute details.
 ### Connectors Health
The Connector's health in the application displays a clear indicator of the connection status of a connector. Monitor connector health to ensure the smooth functioning of data pipelines and workflows.
The Connectors health column displays a green icon when the connection is active and a red icon when the connection is inactive. If the connection is saved without validation, the status will display as a Grey icon. This allows users to quickly and easily identify any issues with their connectors. The Connectors health column can be accessed from Administration > Connectors.
 To view the connector health, select the desired connector and click next to the status button under connector health. A pop-up displays the connector's health.
 * Health: The status of the connector validation.
* Health Check Date: The date and time of the connector validation.
* Details: The details of the connector validation, such as the errors that were found.
* Mode: The mode of the connector validation, such as Auto and Manual.
### Connectors Summary
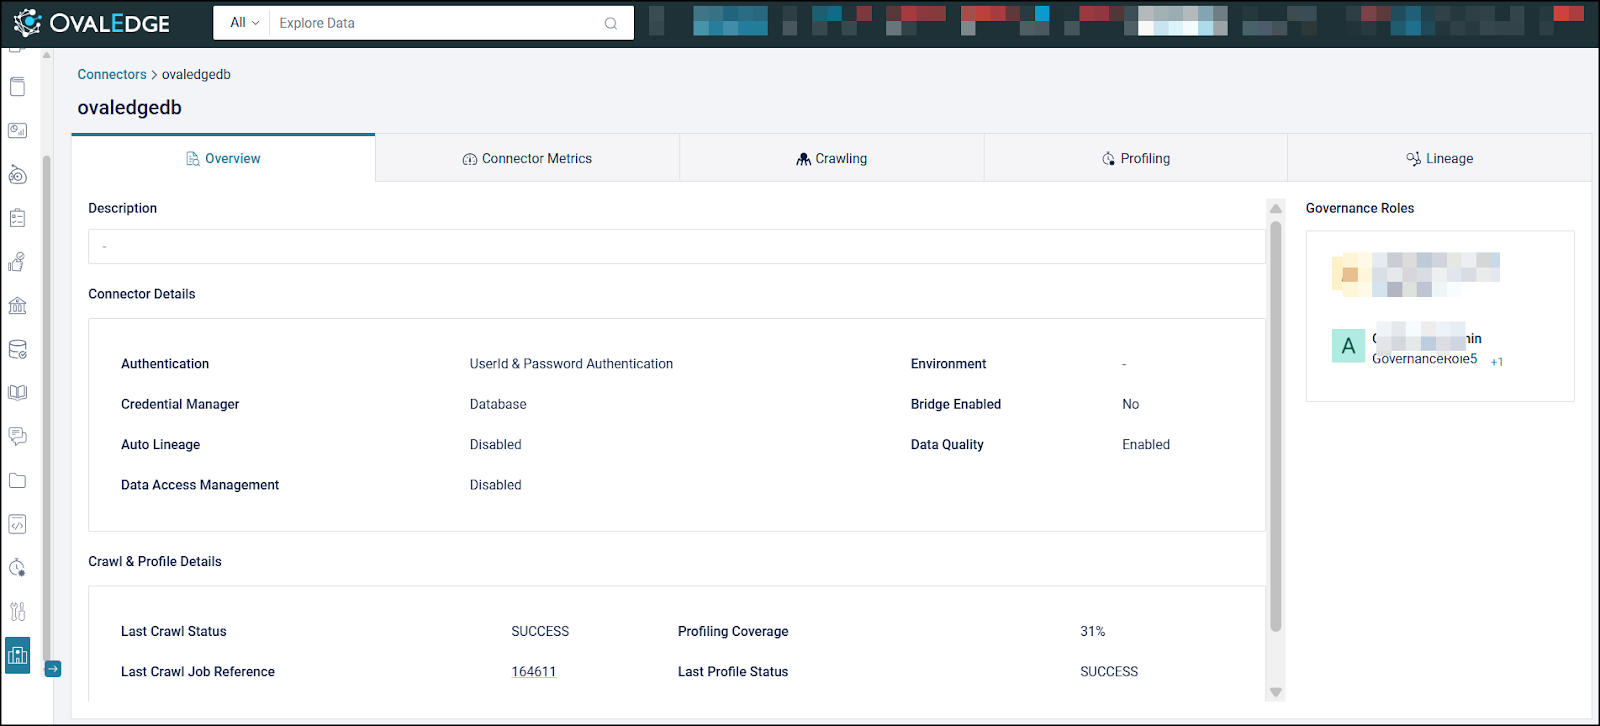
The Connector Summary Page provides a centralized view of a connector, displaying key details, governance roles, metadata crawl and profiling information, job execution statistics, recent activities, scheduled jobs, and associated workflows. It enables efficient monitoring, management, and analysis of connector performance and data quality.
To view the connector summary, click the connector name from the list of configured connectors available on the Connector page. Once opened, five tabs are displayed: **Overview**, **Connector Metrics**, **Crawling**, **Profiling** (if applicable), and **Lineage** (if applicable). Each tab presents specific insights into connector configuration and activity.
* Displays connector description, authentication type, credential manager, environment, and governance roles (Data Steward, Data Owner, Data Custodian, Integration Admin, Security Admin).
* Shows crawl details: last crawl status, job reference, duration, and objects (new, updated, deleted).
* Shows profiling details: coverage %, last profile status, job reference, and top profiled tables (table name, row count, null %, distinct %) with pagination.
* Displays recent job activity with job ID, type, triggered by, status, duration, and error message; supports pagination.
* Shows all scheduled jobs with type, frequency, scheduled run time, and associated workflows.
 ### View Connectors Details
Users can view the required connector’s database details by clicking the View icon. The Looker connector is taken here as an example. All its database counts details, such as the total number of Domains, Reports, Report Columns, and Codes, are displayed.
 ### Connectors Action Menu (nine dots)
#### **Edit connector**
**To edit a connector,**
* Go to the Administration > Connectors page.
* Select a connection and click the Nine Dots button.
* Select the **Edit Connector** option to update the existing data source.
 * Update the details, then save and validate the connection again.
#### **Validate Connector**
Users can select the required connection and click on the Validate Connector option from the Nine Dots icon to validate it.
 #### **Settings**
The Settings option allows users to update the settings for the chosen connector.
 #### **Build Lineage**
The crawler supports crawling views, procedures, and source codes. Once crawled, lineage for the respective source can be built.
Source code parsing algorithms are used to parse various types of source code to build lineage and relationships automatically. Lineage can currently be built from the following:
* SQL query logs - When a query is executed on the database, the crawler can capture and parse the query to identify the source and destination.
* Source Code Parsing - PL/SQL (Oracle), T-SQL (SQL Server), and Teradata SQL can be parsed to build lineage.
* Reporting / Visualization Tools - Lineage can be built from tools such as Tableau, QlikView, Qlik Sense, SAP Business Objects, Crystal Reports, and Power BI
 #### **Delete Connector**
Delete a database schema based on what the user intends to remove. Users can delete any connection type, including RDBMS, Reports, or Files.
**To delete a database connection,**
1. Click on the Nine dots button and select the Delete Connector button. Choose database or schema (if schema, select the applicable schema).
 2. Enter the name of the Connector or Schema.
3. Select the schema(s) and click the Delete button to delete.
 4. When the deletion of the data source is successful, an alert message will appear that the deleted job has been submitted.
{% hint style="info" %}
Once the Job is successful, the respective datasource will be removed from the application.
{% endhint %}
#### **Rename Connector**
The Rename Connector feature allows changing the name of an existing connector. This is useful when aligning connector names with updated naming conventions.
**To rename a connector:**
* Click on the 9-Dots menu.
* Select the Rename Connector option.
 * In the pop-up, enter the Current Name and the New Name.
* Click **Update** to proceed.
 Once submitted, an alert message will confirm that the rename job has been initiated. A background job will handle the update, and it may take some time for the new name to reflect throughout the application.
{% hint style="info" %}
After the job is successful, the old connector will be removed from the application and replaced with the renamed one. However, previously curated descriptions and collaboration notes will not be automatically updated with the new name.
{% endhint %}
***
Copyright © 2025, OvalEdge LLC, Peachtree Corners GA USA
